Analytics.
Track your loyalty program's performance
The analytics section shows how your loyalty program is performing. Use these metrics to optimize your rewards and engagement strategies.
Comparing programs
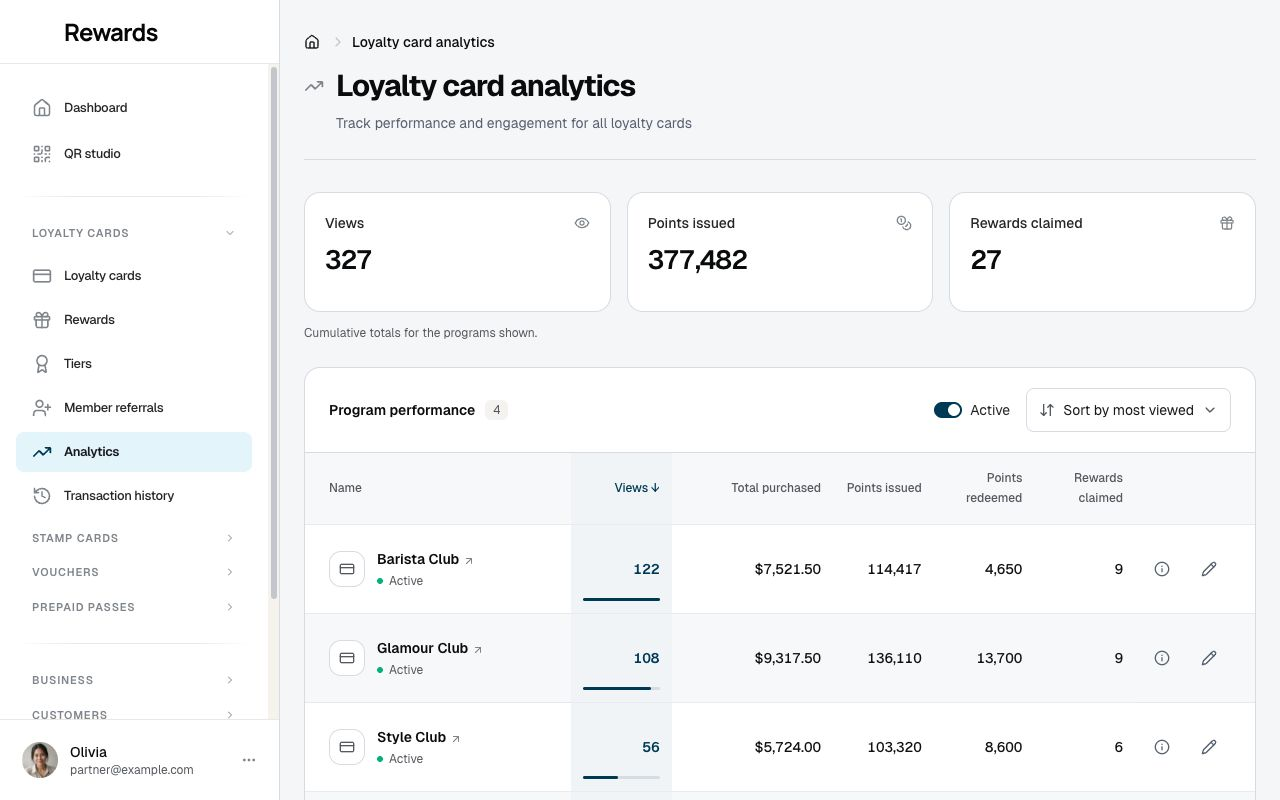
Open Loyalty cards > Analytics to compare your cards. The summary shows cumulative views, points issued and rewards claimed for the programs currently shown. The Active filter and sort menu apply to the comparison below.
Sort by a numeric metric to see proportional bars in that column. Bars compare the displayed programs, with monetary amounts compared only within the same currency. They show relative size, not a historical trend. When you sort by a date, that timestamp appears beneath each program name.
Select a program name to open its analytics dashboard. Use the information button for references, expiry and recent timestamps, or the pencil to edit the program. On phones, each program has a labelled metric grid. Stamp cards > Analytics uses the same pattern for views, stamps, completed cards and rewards claimed.
The card dashboard
Open a card to see its dashboard for the period you choose. Metric tiles lead with page views and its trend, then points issued, points redeemed, rewards claimed, and the share of points that get redeemed. The headline tiles carry a small trend line. Two charts run the full width of the page: card and reward views, then points issued, points redeemed, and rewards claimed side by side. The header names the period you are viewing and keeps the public page and edit actions in reach.
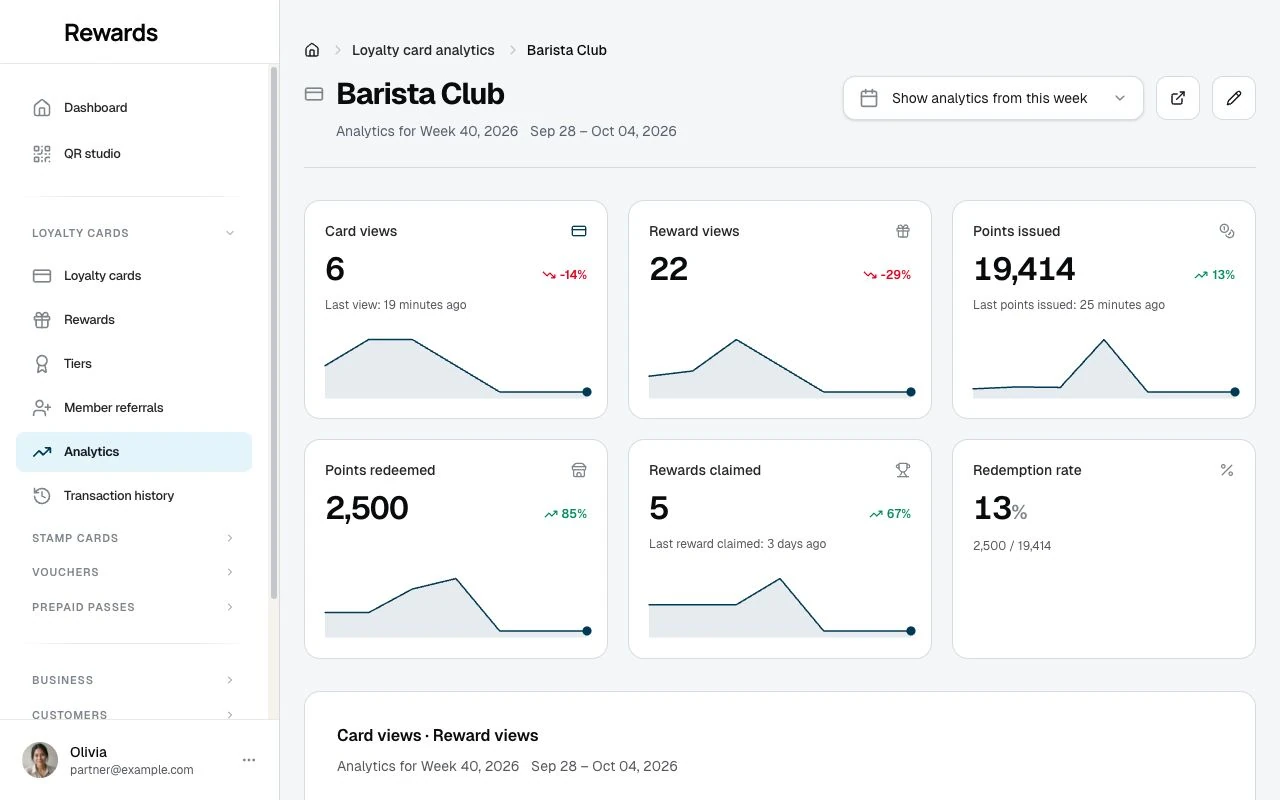
A Recent Activity feed at the foot of the page lists the latest events for the card, who earned or redeemed points and when, with a link to the full transaction history.
Dashboard overview
The partner dashboard separates points activity from the wider member list:
| Metric | What it counts |
|---|---|
| Members with points activity | Distinct members in your points transaction history, with the active-this-month count |
| Points transactions | Points transactions this month |
| Program templates | Active and inactive program definitions; excludes issued voucher codes |
The headline trend charts cover 14 days. The separate activity panel covers seven days. These figures have different scopes from Customers → Members, which also includes people who only hold a program without using it.
Key metrics
Card views
How many times your loyalty card has been viewed. This indicates awareness and reach.
Reward views
How many times the card’s rewards were viewed during the selected period.
Points activity
| Metric | What It Tells You |
|---|---|
| Points issued | How much you're rewarding customers |
| Points redeemed | How engaged customers are with rewards |
Redemption rate
Percentage of earned points that get redeemed. Compare it with your own earlier periods and consider the time members need to earn a reward.
A lower rate can be a reason to review reward prices or availability. A higher rate shows more redemption activity; check the cost of those rewards before changing the program. There is no single target that fits every business.
Time periods
Pick a period from the selector in the header:
| Range | Compares |
|---|---|
| This Day | Today vs. yesterday |
| This Week | This week vs. last week |
| This Month | This month vs. last month |
| This Year | This year vs. last year |
Weeks run Monday through Sunday. Use the period selector for today, yesterday, this or last week, this or last month, and this or last year.
Using analytics
Track launches. When you introduce a new reward, watch how redemption patterns change.
Identify drop-off. If members collect your card but never earn points, your point rules might be confusing or transactions aren't being recorded.
Optimize rewards. See which rewards are most popular. Consider adding similar options or retiring unpopular ones.
Seasonal patterns. Notice when your program is most active. Plan promotions around those periods.
Tier distribution
If you use Membership Tiers, the Tiers list shows a member count per tier. That column is the quickest read on how your members spread across levels; use it to adjust your thresholds.
Data export
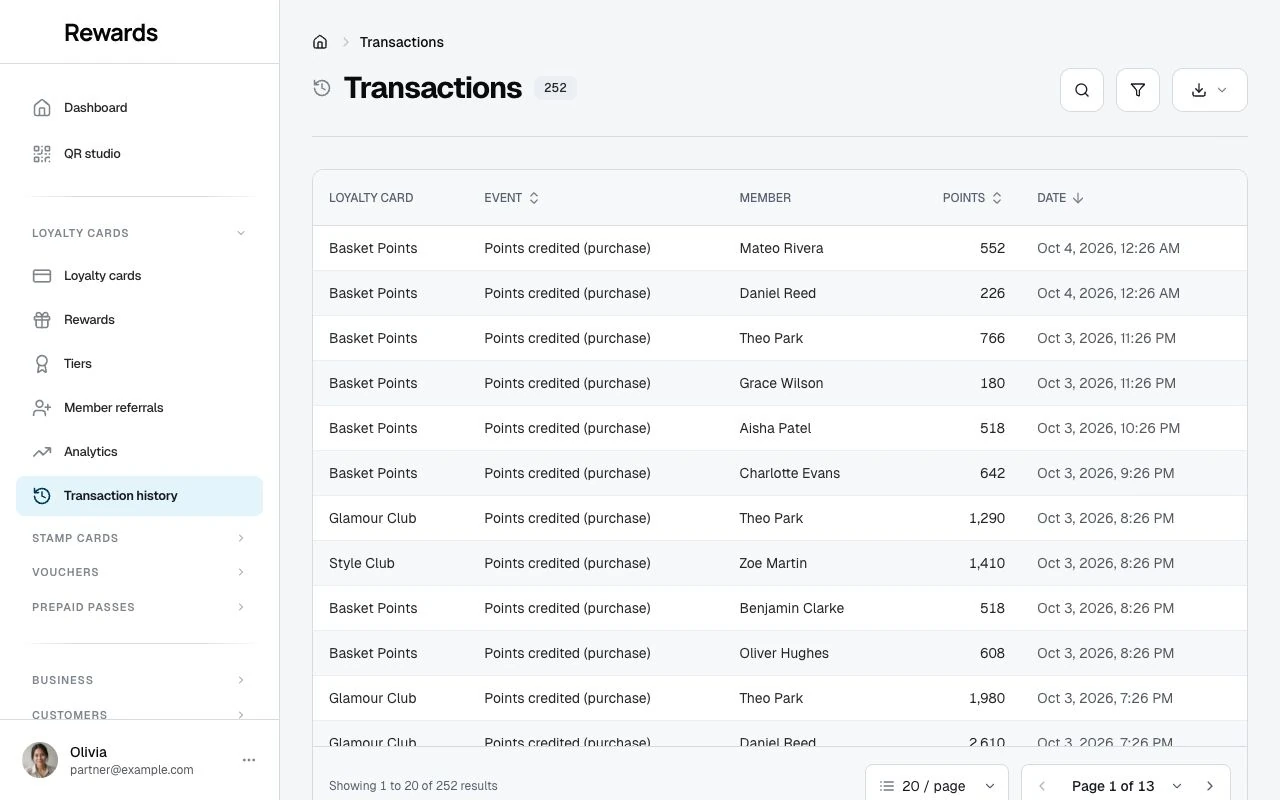
For transaction-level data, open Transaction history in the partner sidebar. The list is searchable and filterable, and exports to CSV, TSV, or JSON. A single export caps at 50,000 rows; use filters to narrow larger ledgers.
Related topics
- Creating Cards: Design your loyalty program
- Membership Tiers: VIP levels and benefits
- Activity logs: Detailed audit trail