Voucher performance analytics.
Track views, redemptions, discount amounts, and compare time periods to optimize campaigns.
Analytics help you understand which vouchers are working and why. Track views, redemptions, discount amounts, and member engagement to optimize your promotional campaigns.
💡 Feedback welcome: We welcome feedback on what metrics would be most valuable for your business.
Analytics overview
Access voucher analytics from Vouchers > Analytics in the partner sidebar.
The overview compares your manually created vouchers. Its summary shows cumulative views, redemptions and discount amounts for the programs currently shown, with separate discount totals for each currency. Batch-generated vouchers are excluded here; their claims and redemption rates live on the batches dashboard.
| Metric | What It Tells You |
|---|---|
| Views | Interest and reach |
| Times Used | Actual redemptions |
| Total Discount Given | Recorded monetary discounts |
| Unique Members | Customer reach |
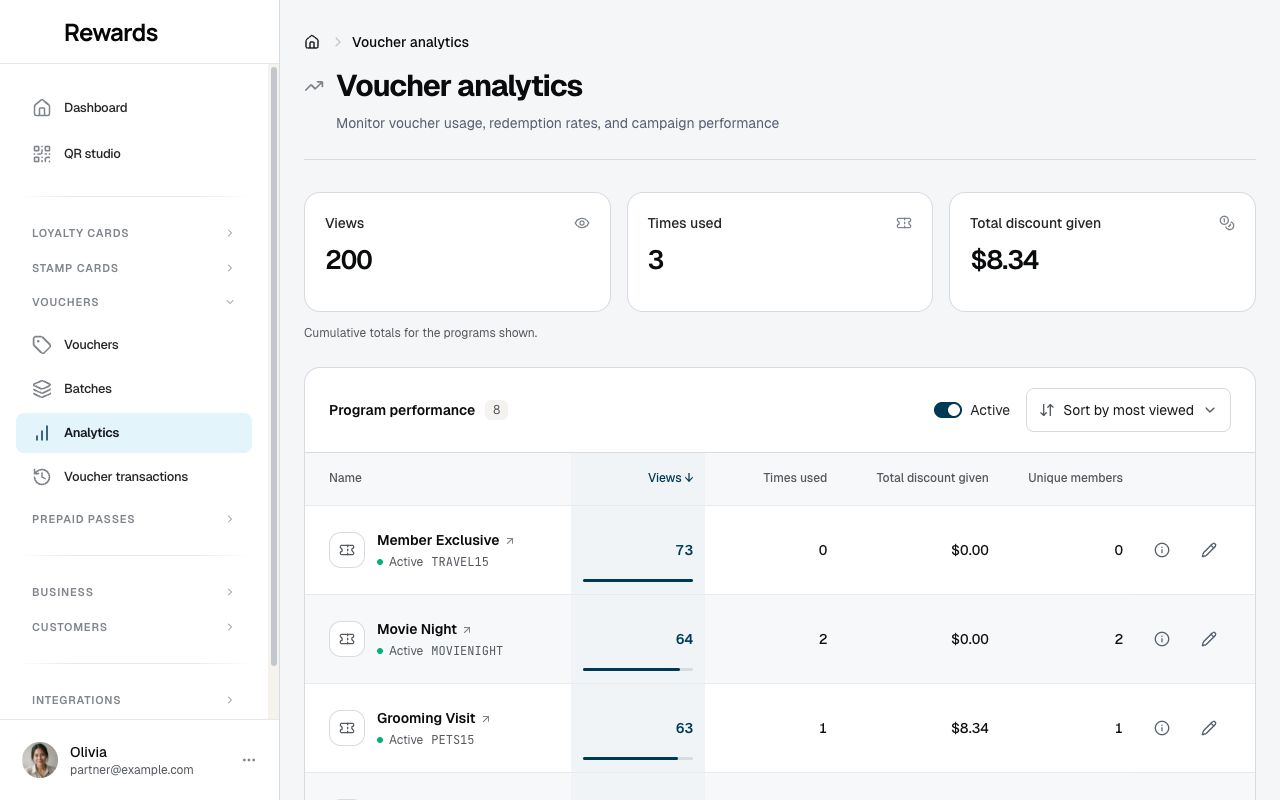
Use Active and the sort menu to choose what to compare. Sorting by a numeric metric adds proportional bars to that column; amounts are compared within each currency. Select a voucher name for its analytics dashboard, the information button for its code, benefit, validity and latest view, or the pencil to edit it. Codes beside the status distinguish vouchers with the same name. Date sorts show the relevant timestamp beneath each name. Phone and tablet layouts use a labelled metric grid that adapts to the available width.
Understanding each metric
Views
How many times customers have viewed the voucher detail page.
How it's tracked: One view per visitor per browser session. Repeat opens in the same session don't count as new views; a new session does.
Why it matters: High views show your voucher is getting attention. Low views may indicate visibility or promotion issues.
Interpretation:
- High views, low redemptions → Offer may not be strong enough
- Low views, high redemptions → Voucher is working but needs more exposure
- High views, high redemptions → Winning combination
Times used
Total number of successful redemptions.
Why it matters: This is the ultimate measure of voucher success. Redemptions mean customers took action.
Interpretation:
- Track against your goals (100 redemptions in first week)
- Compare across vouchers (which types perform best)
- Monitor for unusual patterns (sudden spikes or drops)
Total discount given
Sum of all discount amounts across all redemptions.
Why it matters: This is the recorded monetary discount, not the full campaign cost. Include product, advertising and staff costs when you assess the campaign.
Example:
- 50 redemptions × average $8 discount = $400 total discount given
- If those 50 customers spent $2,500 total, your discount cost was 16% of revenue
Unique members
Number of different customers who have redeemed this voucher.
Why it matters: Shows customer reach. 100 redemptions by 100 members is different from 100 redemptions by 10 members.
Interpretation:
- Unique Members < Times Used → Some customers using multiple times (if allowed)
- Unique Members = Times Used → Each customer used it once
- Higher unique count → Broader customer reach
Sorting & filtering
Sort options
Sort your voucher list by:
| Sort By | Use When |
|---|---|
| Newest/Oldest First | Finding recent or historical vouchers |
| Most/Fewest Views | Identifying popular or underperforming vouchers |
| Most/Fewest Redemptions | Finding top/bottom performers |
| Highest/Lowest Discount Given | Analyzing cost by voucher |
| Most/Fewest Members Reached | Measuring customer penetration |
| Most/Least Recently Viewed | Finding active vouchers |
Filtering
Active toggle: The Active control beside the sort menu hides expired or deactivated vouchers, so you focus on current campaigns.
Detailed voucher analytics
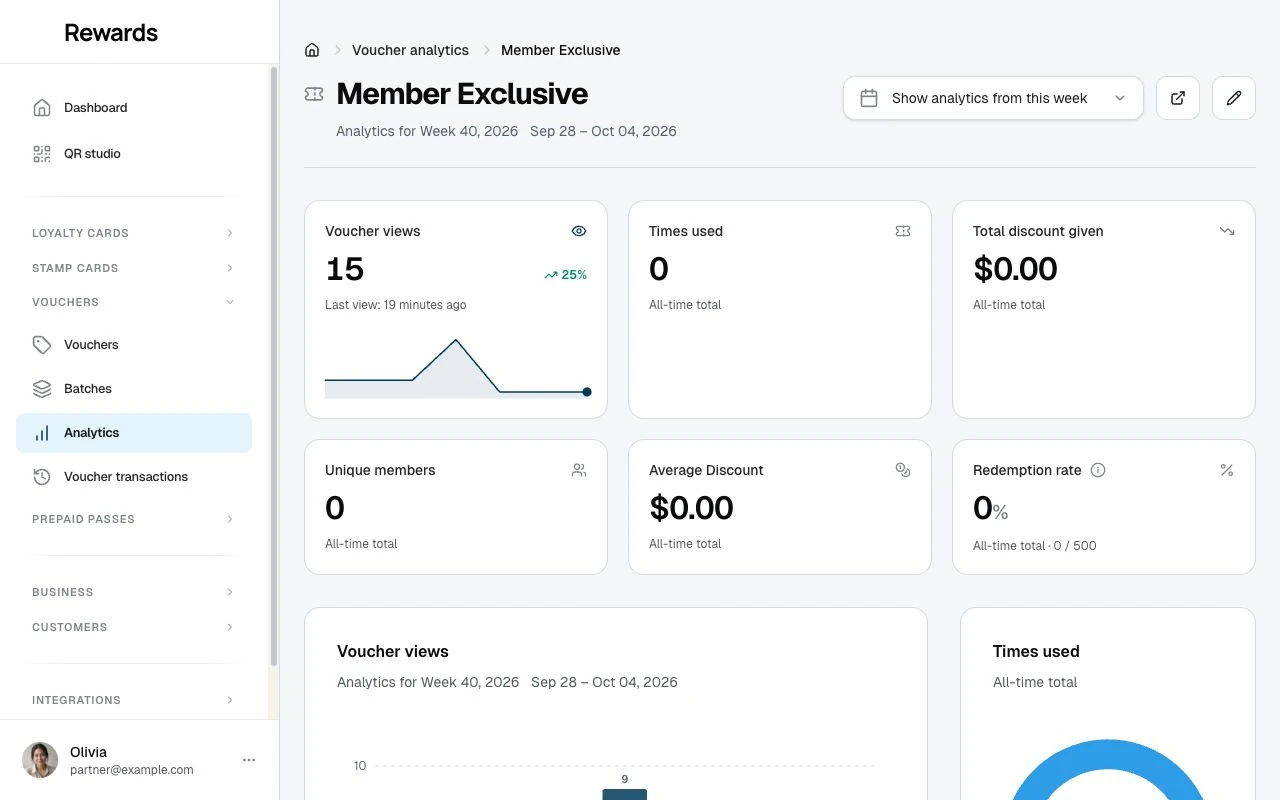
Select an active voucher’s name to open its dashboard: KPI tiles for views (with a period trend), times used, total discount given, unique members, the average discount per redemption, and (for capped vouchers) the redemption rate. A views bar chart follows the selected period; capped vouchers also show a used-versus-remaining donut, and a Recent Activity feed of the latest redemptions sits at the bottom, with a link to the full ledger.
Time range selection
Choose from:
| Range | Compares |
|---|---|
| This Day | Today vs. Yesterday |
| This Week | This week vs. Last week |
| This Month | This month vs. Last month |
| This Year | This year vs. Last year |
Weeks run Monday through Sunday. Choose today, yesterday, this or last week, this or last month, or this or last year from the period selector.
Statistics dashboard
The selected period applies to Voucher views, its chart, and its comparison with the preceding period. Times used, total discount, unique members, average discount, and usage remain all-time totals.
A percentage comparison appears when the previous period has views. It describes a change in page views, not a change in every metric.
Interpreting trends
Compare views with the all-time use figures to understand interest and uptake. Export dated redemptions if you need a redemption comparison for a particular period.
Views chart
Bar chart showing views over time:
- X-axis: Time periods (days, weeks, months, years based on range)
- Y-axis: View count
- Interaction: Hover for exact values
What to look for:
- Spikes on specific dates (promotions, events)
- Gradual trends (growing or declining interest)
- Day-of-week patterns (weekend vs. weekday)
- Correlation with marketing activities
Calculating key ratios
Conversion rate
Conversion Rate = (Redemptions / Views) × 100
Example: 50 redemptions from 1,000 views = 5% conversion rate
Use this ratio to compare similar campaigns. Views are browser-session counts, while one member may redeem more than once, so the ratio is not a count of distinct visitors who purchased. Avoid treating a fixed percentage as a universal success threshold.
Average discount per redemption
Average Discount = Total Discount Given / Times Used
Example: $400 total discount / 50 redemptions = $8 average
Track this to ensure individual discounts match expectations.
Customer acquisition cost (if new customers)
Discount cost per new customer = Total Discount Given / New Customers Acquired
Example: $400 discount / 30 new customers = $13.33 per customer
This counts discounts only. It is not your full acquisition cost or return on investment: advertising, staff time, product costs, and other expenses are not included. Identify genuinely new customers separately before using this calculation.
Analyzing campaign performance
Comparing vouchers
View multiple vouchers side-by-side in the overview to identify:
- Top performers: High views AND redemptions
- Hidden gems: Low views but high conversion
- Underperformers: High views but few redemptions
- Costly campaigns: High discount given with low unique members
Questions to ask
- Which voucher type performs best? Compare percentage vs. fixed vs. free product
- What's the optimal discount level? Does 20% outperform 15%?
- When do customers engage? Weekend vs. weekday patterns
- Which targeting works? New members vs. all members vs. VIPs
A/B testing approach
Create similar vouchers with one variable changed:
Test discount level:
- SUMMER15: 15% off
- SUMMER20: 20% off
- Compare redemptions and discount cost
Test minimum purchase:
- SPEND25: $10 off $25+
- SPEND50: $10 off $50+
- Compare redemptions and average order value
Taking action on data
High views, low redemptions
The voucher is being seen but not used.
Possible causes:
- Discount not strong enough
- Requirements too strict (minimum purchase, eligibility)
- Expiration too soon
- Design doesn't convey value
Actions:
- Increase discount or remove minimum
- Extend validity period
- Improve voucher design
- Simplify eligibility rules
Low views
The voucher isn't being discovered.
Possible causes:
- Not marked as public or homepage featured
- No promotional support
- Customers don't know to look for vouchers
Actions:
- Enable "Show on Homepage"
- Share on social media
- Email to customer list
- Add in-store signage
High discount cost
Spending more on discounts than expected.
Possible causes:
- No maximum discount cap (percentage vouchers)
- A strong offer driving high volume
- Missing minimum purchase requirement
Actions:
- Add or lower the discount cap
- Introduce minimum purchase
- Reduce total usage limit
- End campaign early if needed
One customer, many redemptions
Single customer using voucher excessively.
Check:
- Is per-member limit set?
- Is single-use enabled?
Actions:
- Enable single-use or set per-member limit
- For existing voucher, deactivate and create new with limits
Exporting data
Open the voucher Transaction history to export redemption records as CSV, TSV, or JSON. Apply filters first; a single export contains up to 50,000 rows.
For a batch's voucher codes, use the batch CSV export. See Data export for the shared export controls.
Best practices
Regular review
- Daily: Check active campaigns for anomalies
- Weekly: Review conversion rates and trends
- Monthly: Full campaign analysis
- Per Campaign: Post-campaign review when voucher expires
Documentation
Keep records of:
- Campaign goals (target redemptions, budget)
- Actual performance (redemptions, cost)
- Lessons learned (what worked, what didn't)
This historical data helps optimize future campaigns.
Acting fast
If a voucher is underperforming:
- Diagnose the problem (views, conversion, eligibility)
- Make changes (edit is usually immediate)
- Monitor impact
If a voucher is over-performing (costing too much):
- Reduce limits or deactivate
- Learn from the success for future campaigns
Next steps
- Creating Vouchers: Create optimized vouchers
- Advanced Targeting: Improve targeting
- Best Practices: Campaign optimization tips